
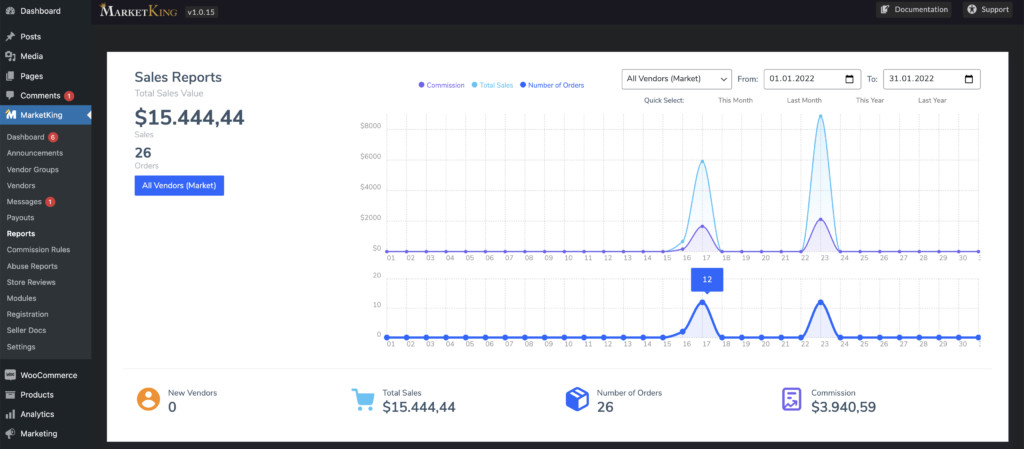
MarketKing provides a dedicated reports panel in the admin backend that offers an overview of store performance over time. The plugin tracks 4 key metrics: total sales, admin commission, number of orders, and new vendors.
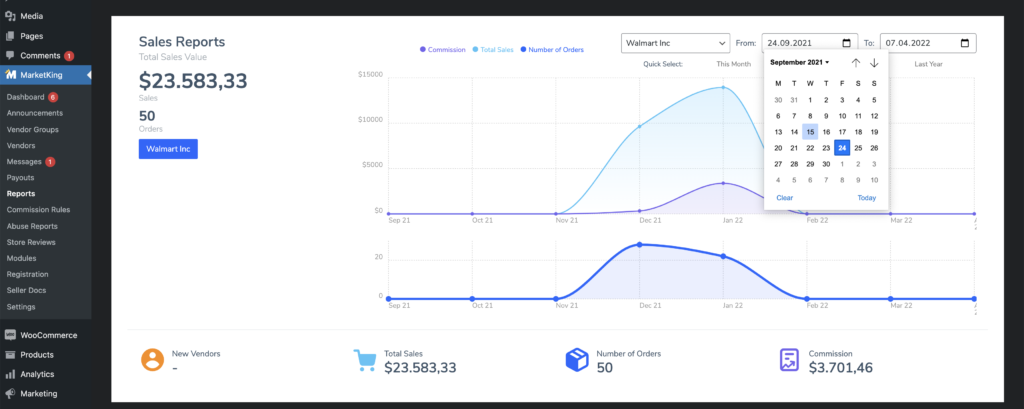
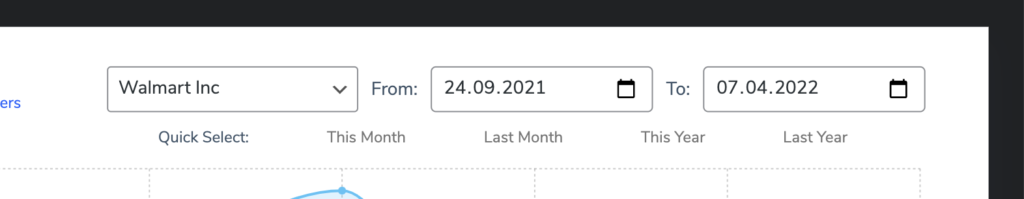
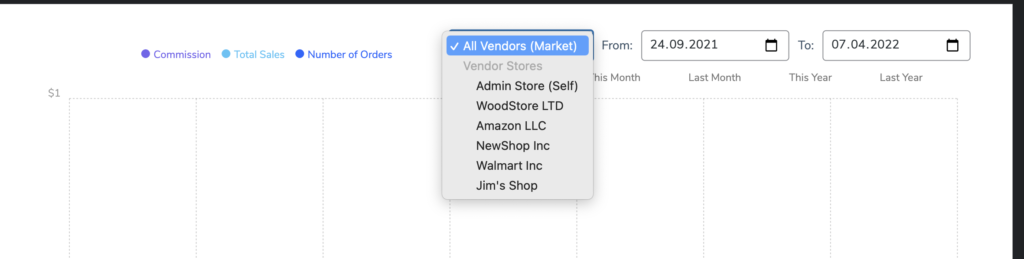
The admin can select a specific period using the "from" and "to" date inputs, as well as choose to view reports for a specific vendor or for all vendors (marketplace performance as a whole).
Additionally, there are 4 "quick select" options: "this month", "last month", "this year", and "last year", which allow you to set the time period with a single click.
Once the configuration has been set or changed, the plugin immediately begins calculating the data and then renders the charts. There are 2 charts displayed:
- A top chart that shows total sales (cyan) and commission (purple)
- A bottom chart that shows the number of orders
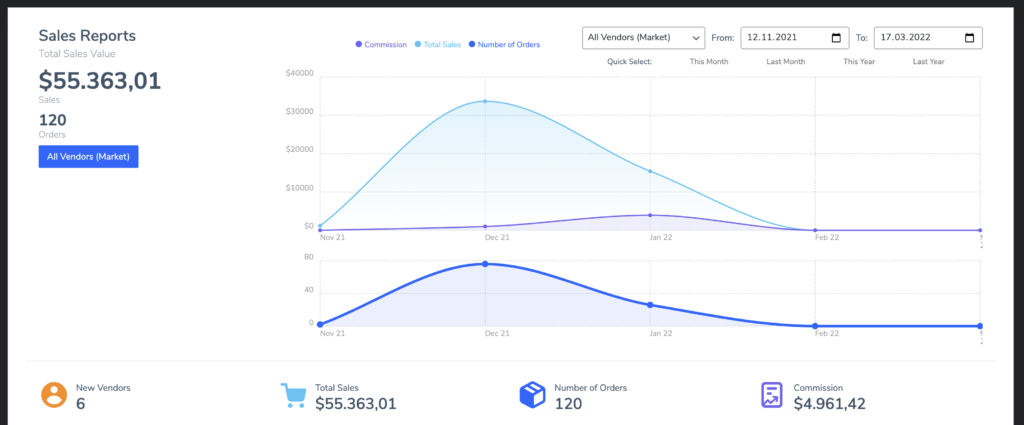
By looking at the 2 charts side by side, the admin can easily determine, for example, whether an increase in sales is also correlated with an increase in the number of orders.
If a period longer than 1 month is selected, the plugin will display performance by month, as shown in the images above. If the period is less than 1 month, the plugin will display performance by day, as shown in the next image.
Vendor Reports & Statistics
This article covers the reports available to the site admin / shop manager in the backend. Vendors also have their own earnings reports in the vendor dashboard. You can read more about vendor earnings & reports.